
Cloudy with a Chance of Data Loss: Modelling the Physical Climate Risk of U.S. Data Centres
Data centres are the invisible backbone of the digital economy. It’s estimated that 94% of companies use cloud services hosted by a global network of data centres. The market was estimated to be worth $913 billion in 2025, a six fold increase since 2020. In this feature, TransZero research shares risk modelling insights on the US exposure of these data centres to physical weather extremes and how this might be changing through the 21st century in a warming climate.
The rise of cloud computing
The COVID-19 pandemic prompted a rapid shift towards cloud-based solutions to support remote work and address operational disruptions. Almost every sector, including finance, healthcare, manufacturing, transportation, education, and government, depends on uninterrupted digital services. Data centres power cloud computing, financial transactions, logistics, emergency services, and the digital platforms that underpin daily life. Yet despite their importance, the climate risks facing data centres remain poorly understood. The accelerating pace of climate change introduces new stressors that exceed historical design assumptions.
The recent transformation of how data is stored, processed, and accessed is staggering. Global data creation is rising at an extraordinary pace. In 2025, the world generated an estimated 173 zettabytes of data, and projections indicate this figure will soar to 527 zettabytes by 2029. For reference, 1 zettabyte translates to 1,000 exabytes, 1,000,000 terabytes, or 1,000,000,000 gigabytes. In other words, data storage is expected to triple within just four years. Furthermore, cloud computing has become a dominant force in global IT, with the market reaching over half a trillion dollars in revenue in 2023 and continuing to accelerate as organizations digitize operations and adopt AI.
In the United States investment in Data Centers was 25 times higher in 2025 ($42 billion USD) than it was in 2014 (US Census Bureau, Figure 1).
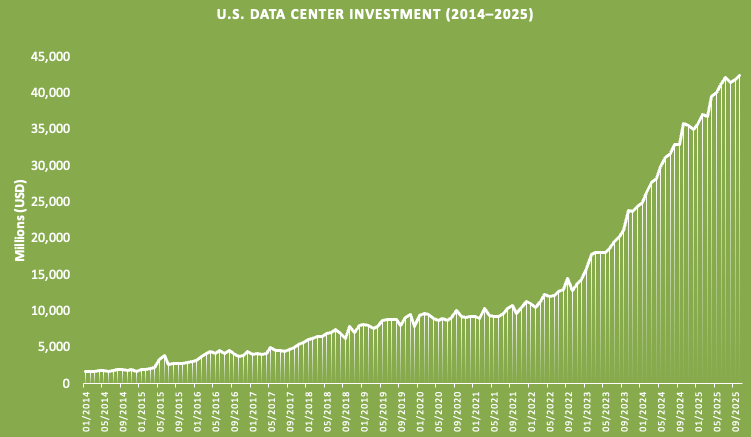
Figure 1: U.S. Data Center Investment, 2014-2025 (US Census Bureau)
The vulnerability of large industrial facilities to extreme weather was exemplified in December 2021 when an Amazon warehouse in Edwardsville, Illinois, was torn apart by a tornado with 150-mph (240-kmh) winds. The event resulted in six fatalities and a significant financial loss but also raised questions about the resilience of large industrial and digital infrastructure in the face of intensifying climate extremes such as Severe Convective Storms (SCS). Although data centers are engineered for reliability, their large spatial footprints, high energy loads, and dependence on uninterrupted cooling make them particularly vulnerable to extreme weather events (CNBC 2021).
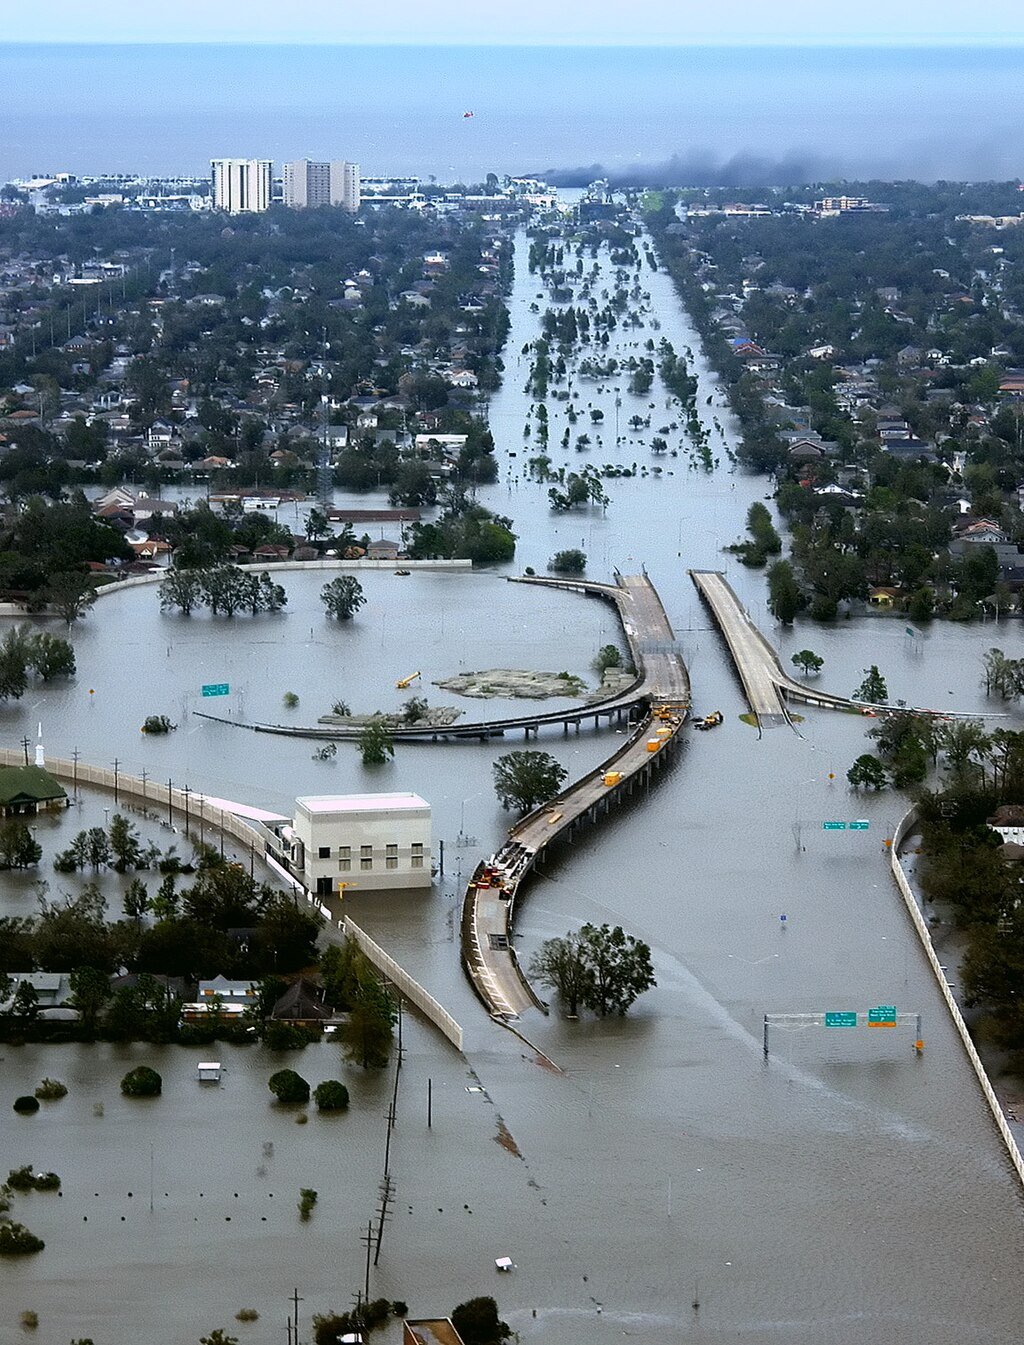
Figure 2: Hurricane Katrina (2005) - Flooding at Interstate 10 at West End Boulevard (AP Photo/U.S. Coast Guard, Petty Officer 2nd Class Kyle Niemi, Public domain, via Wikimedia Commons)
Figure 2 shows the damage potential of hurricanes. As well as the intense winds, it is often the secondary hazards that have the biggest impact. This was evidenced with Hurricane Katrina’s devastating storm surge that resulted in widespread flooding across the city of New Orleans.
Aside from the direct risk to data centres from extreme weather events it is the wider impact on the internet and cloud hosted services that can potentially have broader impacts. Although the Amazon Web Services (AWS) cloud outage that occurred between the 19th-20th October 2025 was not due to a climate event, it highlighted how any downtime for such data centres can have immediate impacts on the digital economy; impacts including abruptly disrupting streaming services, e‑commerce, gaming, and other everyday services for millions of users. What began as a failure within the US‑EAST‑1 region quickly cascaded into a broader cloud‑service disruption, exposing structural fragilities in the cloud ecosystem and underscoring the systemic risks concentrated in a small number of hyperscale regions (Deployflow 2025).
As the global importance of data centers continues to grow, it is crucial to understand what climate risks threaten them and the extent to which these hazards could compromise availability, infrastructure integrity, and long‑term operational resilience. New research by TransZero modelling a range of physical climate risks to 1,200 U.S. data centres has been undertaken. Property values for each data centre were estimated using a methodology that accounted for data center size (in square feet), location and regional labour costs. In addition to the building value, estimations of infrastructure, contents and business interruption were also estimated.
These inputs were run through the TransZero web climate platform to quantify financial losses based on both a 2026 baseline through to 2100 using two IPCC climate scenarios, SSP2‑4.5 and SSP5‑8.5. These Shared Socioeconomic Pathways represent alternative climate futures, with SSP2 being a less severe warming scenario as global GHG emissions stabilise by the middle of the century, whereas SSP5 reflects a high‑emissions pathway driven by continued economic expansion and heavy reliance on fossil fuels through the remainder of the century. This results in a greater levels of global warming. (NOAA 2021).
The TransZero analysis revealed strong regional patterns of climate risk as well as how some of these climate perils will continue to evolve through the coming decades. Flooding was shown to impact fewer data centers but often resulted in disproportionately high impact losses, while many locations were considered at risk of hazards like hail, tornado and wind (from Tropical Cyclones) though loss uncertainty was far greater due to the uncertainties of Tropical Cyclone and Tornado swaths. This asymmetry has implications for adaptation planning, insurance, and long-term capital investment.
Methodology
The analysis used a dataset of over 1,200 U.S. data centres that included geographic coordinates (latitude and longitude), building size, estimated replacement value, facility type, and operational characteristics. To account for geographic variation in construction, labor, permitting, and regulatory costs, the model incorporated a state-level cost multiplier. Higher-cost states, California, New York, New Jersey, Massachusetts, Washington, Connecticut, and the District of Columbia (Washington, D.C.), were assigned an upward adjustment factor to reflect their elevated land values, labor expenses, and more stringent permitting environments. This multiplier was applied to each facility’s estimated replacement value to ensure that modeled losses more accurately represent the true cost of rebuilding or repairing data centres in these jurisdictions.
As Figure 3 shows the facilities in the dataset are distributed across 44 states, along with one site in Washington, D.C., and one in Puerto Rico. The major digital infrastructure hubs include: the Pacific Northwest, the Bay Area, Southern California, Texas (particularly Dallas and Houston), Virginia, Ohio, Iowa, Arizona, and the New York City metropolitan area. Darker shades highlight spatial hotspots of data centre locations including Washington state. These clusters reflect the geography of fiber networks, energy availability, and corporate presence, but they also create spatial concentrations of climate exposure.
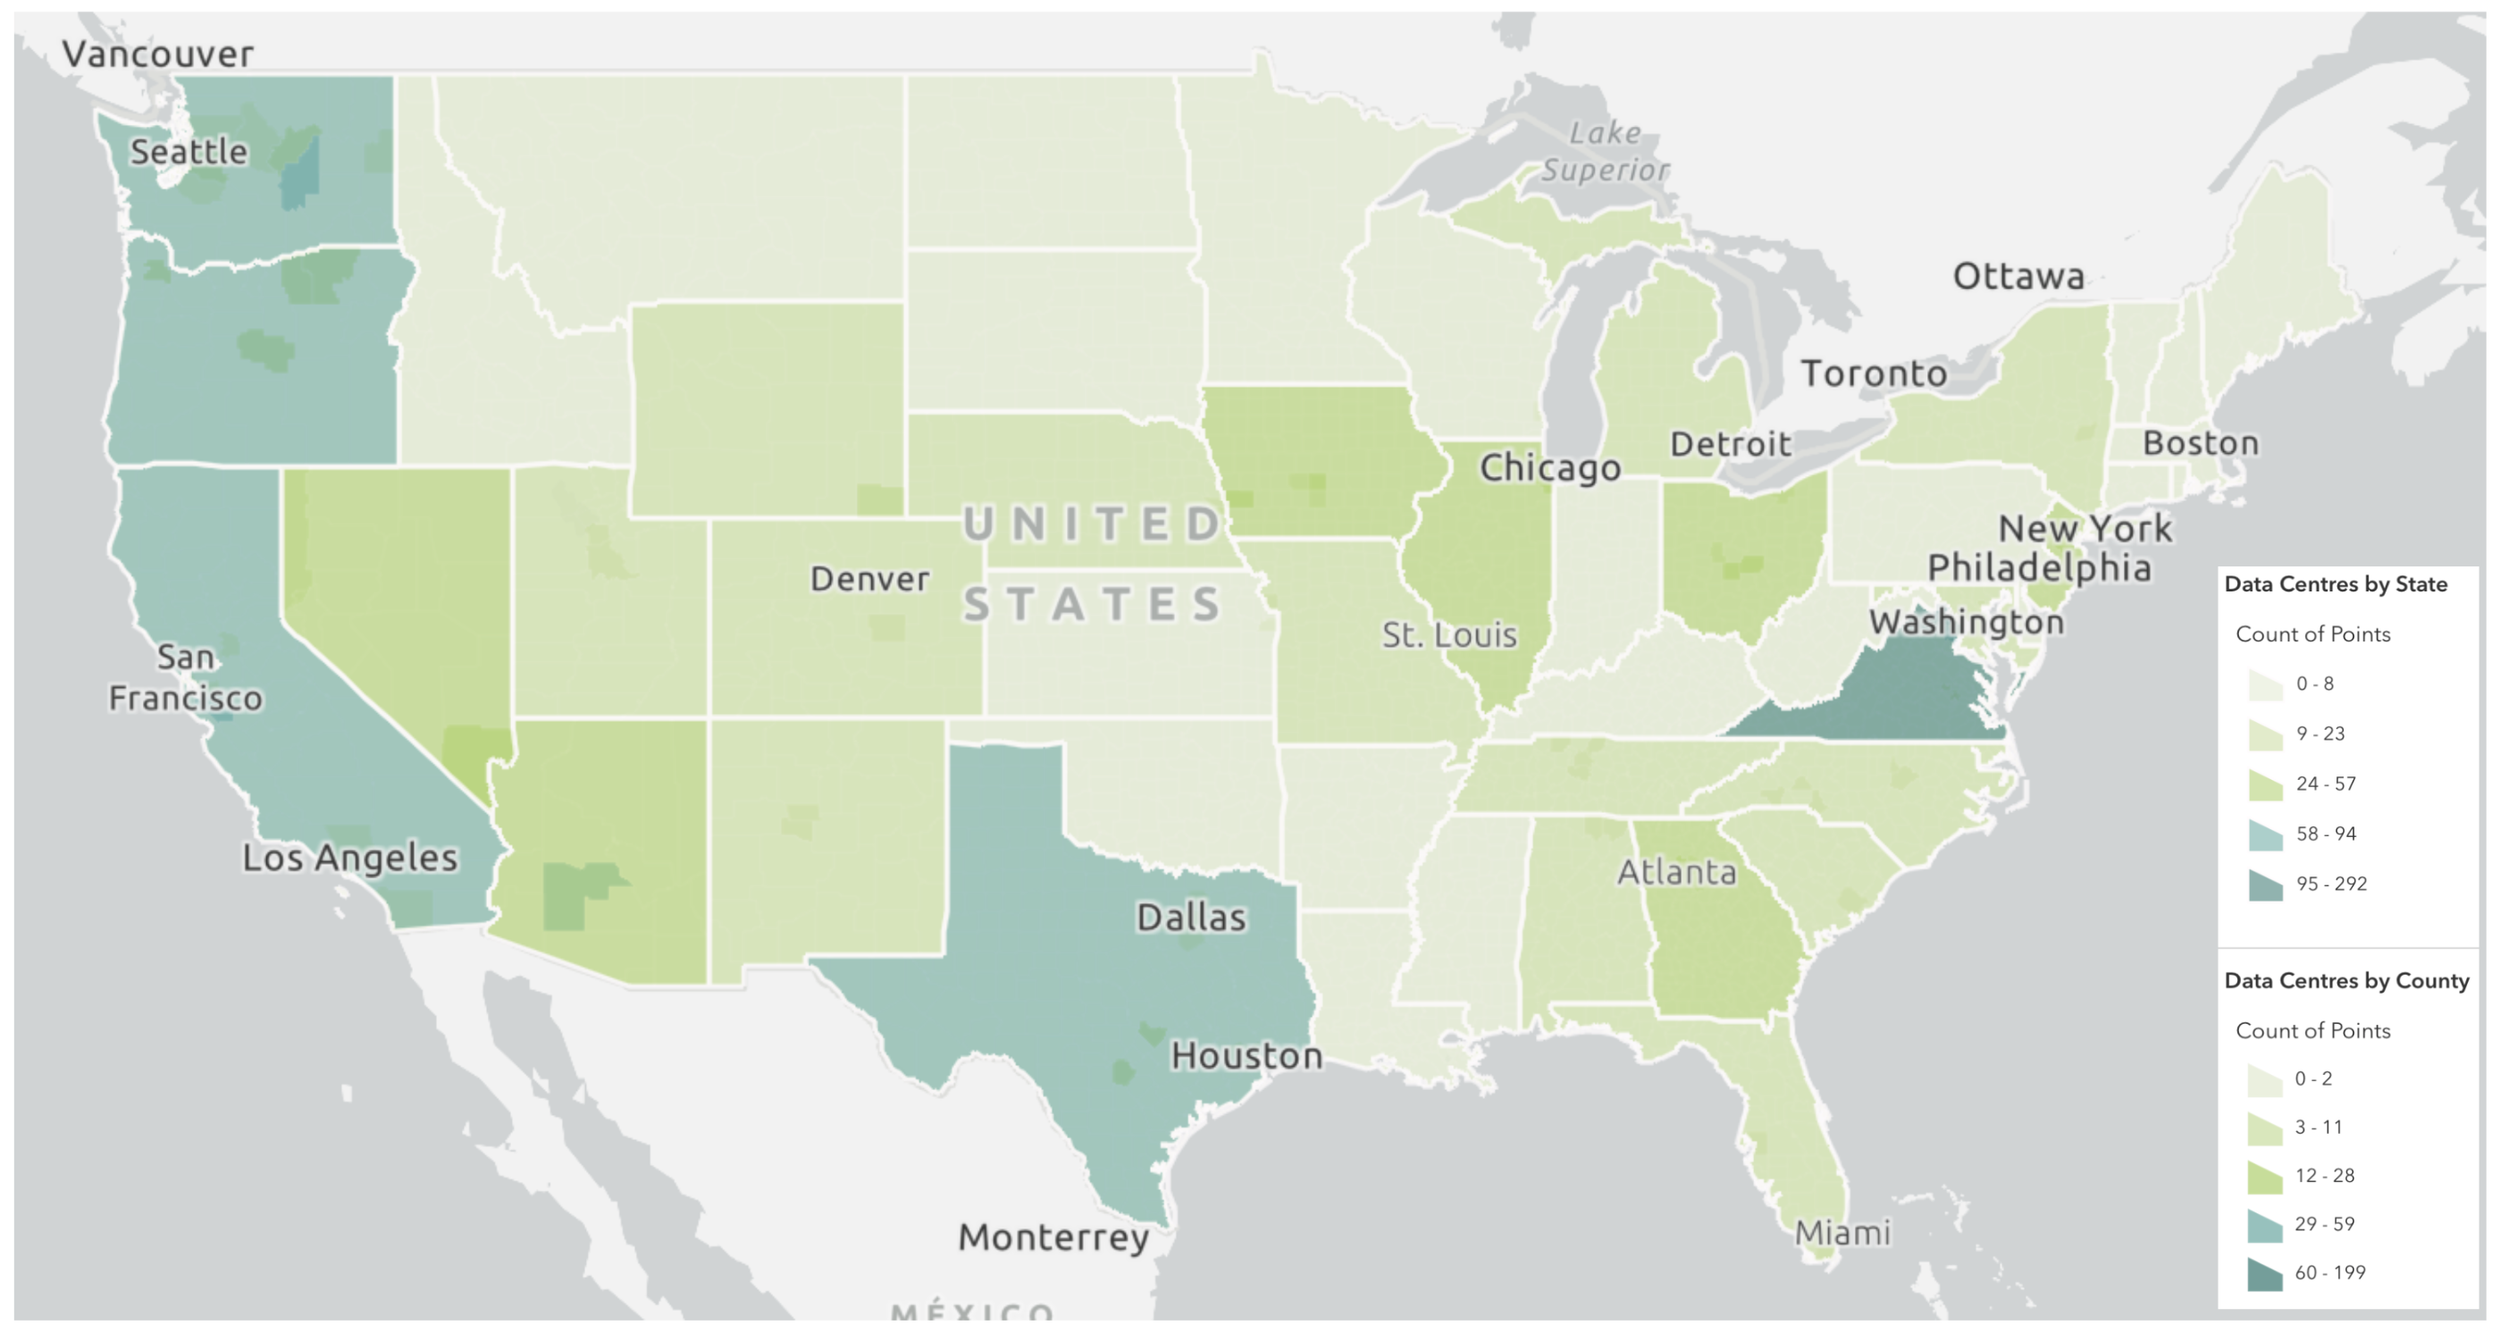
Figure 3: Data Centres by U.S. state and county (copyright TransZero)
Each facility was run through TransZero’s multi-hazard climate model to calculate annual losses as well as providing risk scores and Climate Peril Grades (CPG) for wildfire, hail, extreme temperature, flood, wind, sea level rise, rainfall, subsidence, landslide, drought. Climate perils can broadly be categorised as being acute or chronic. Acute perils are fast-onset risks such as hurricanes and river floods. These tend to be short-lived events whereas chronic risks such as sea level rise and increasing numbers of ‘hot’ days develop more gradually over time.
Surveys have highlighted a concern that chronic risk is likely to impact data centres as days of extreme heat look set to increase across the U.S. (Boston University 2022). This can result in higher energy costs associated with air-conditioning building facilities and managing escalating energy consumption. However, acute climate risks in both the current and future climates highlighted some telling insights.
Results
Regional Patterns of Climate Exposure
The model reveals clear geographic clustering in how U.S. data centres are exposed to climate hazards. These spatial patterns largely mirror established climate dynamics, yet they also highlight emerging vulnerabilities in regions not traditionally associated with certain risks. Together, they illustrate a landscape where exposure is unevenly distributed and shaped by both historical climate regimes and shifting environmental conditions.
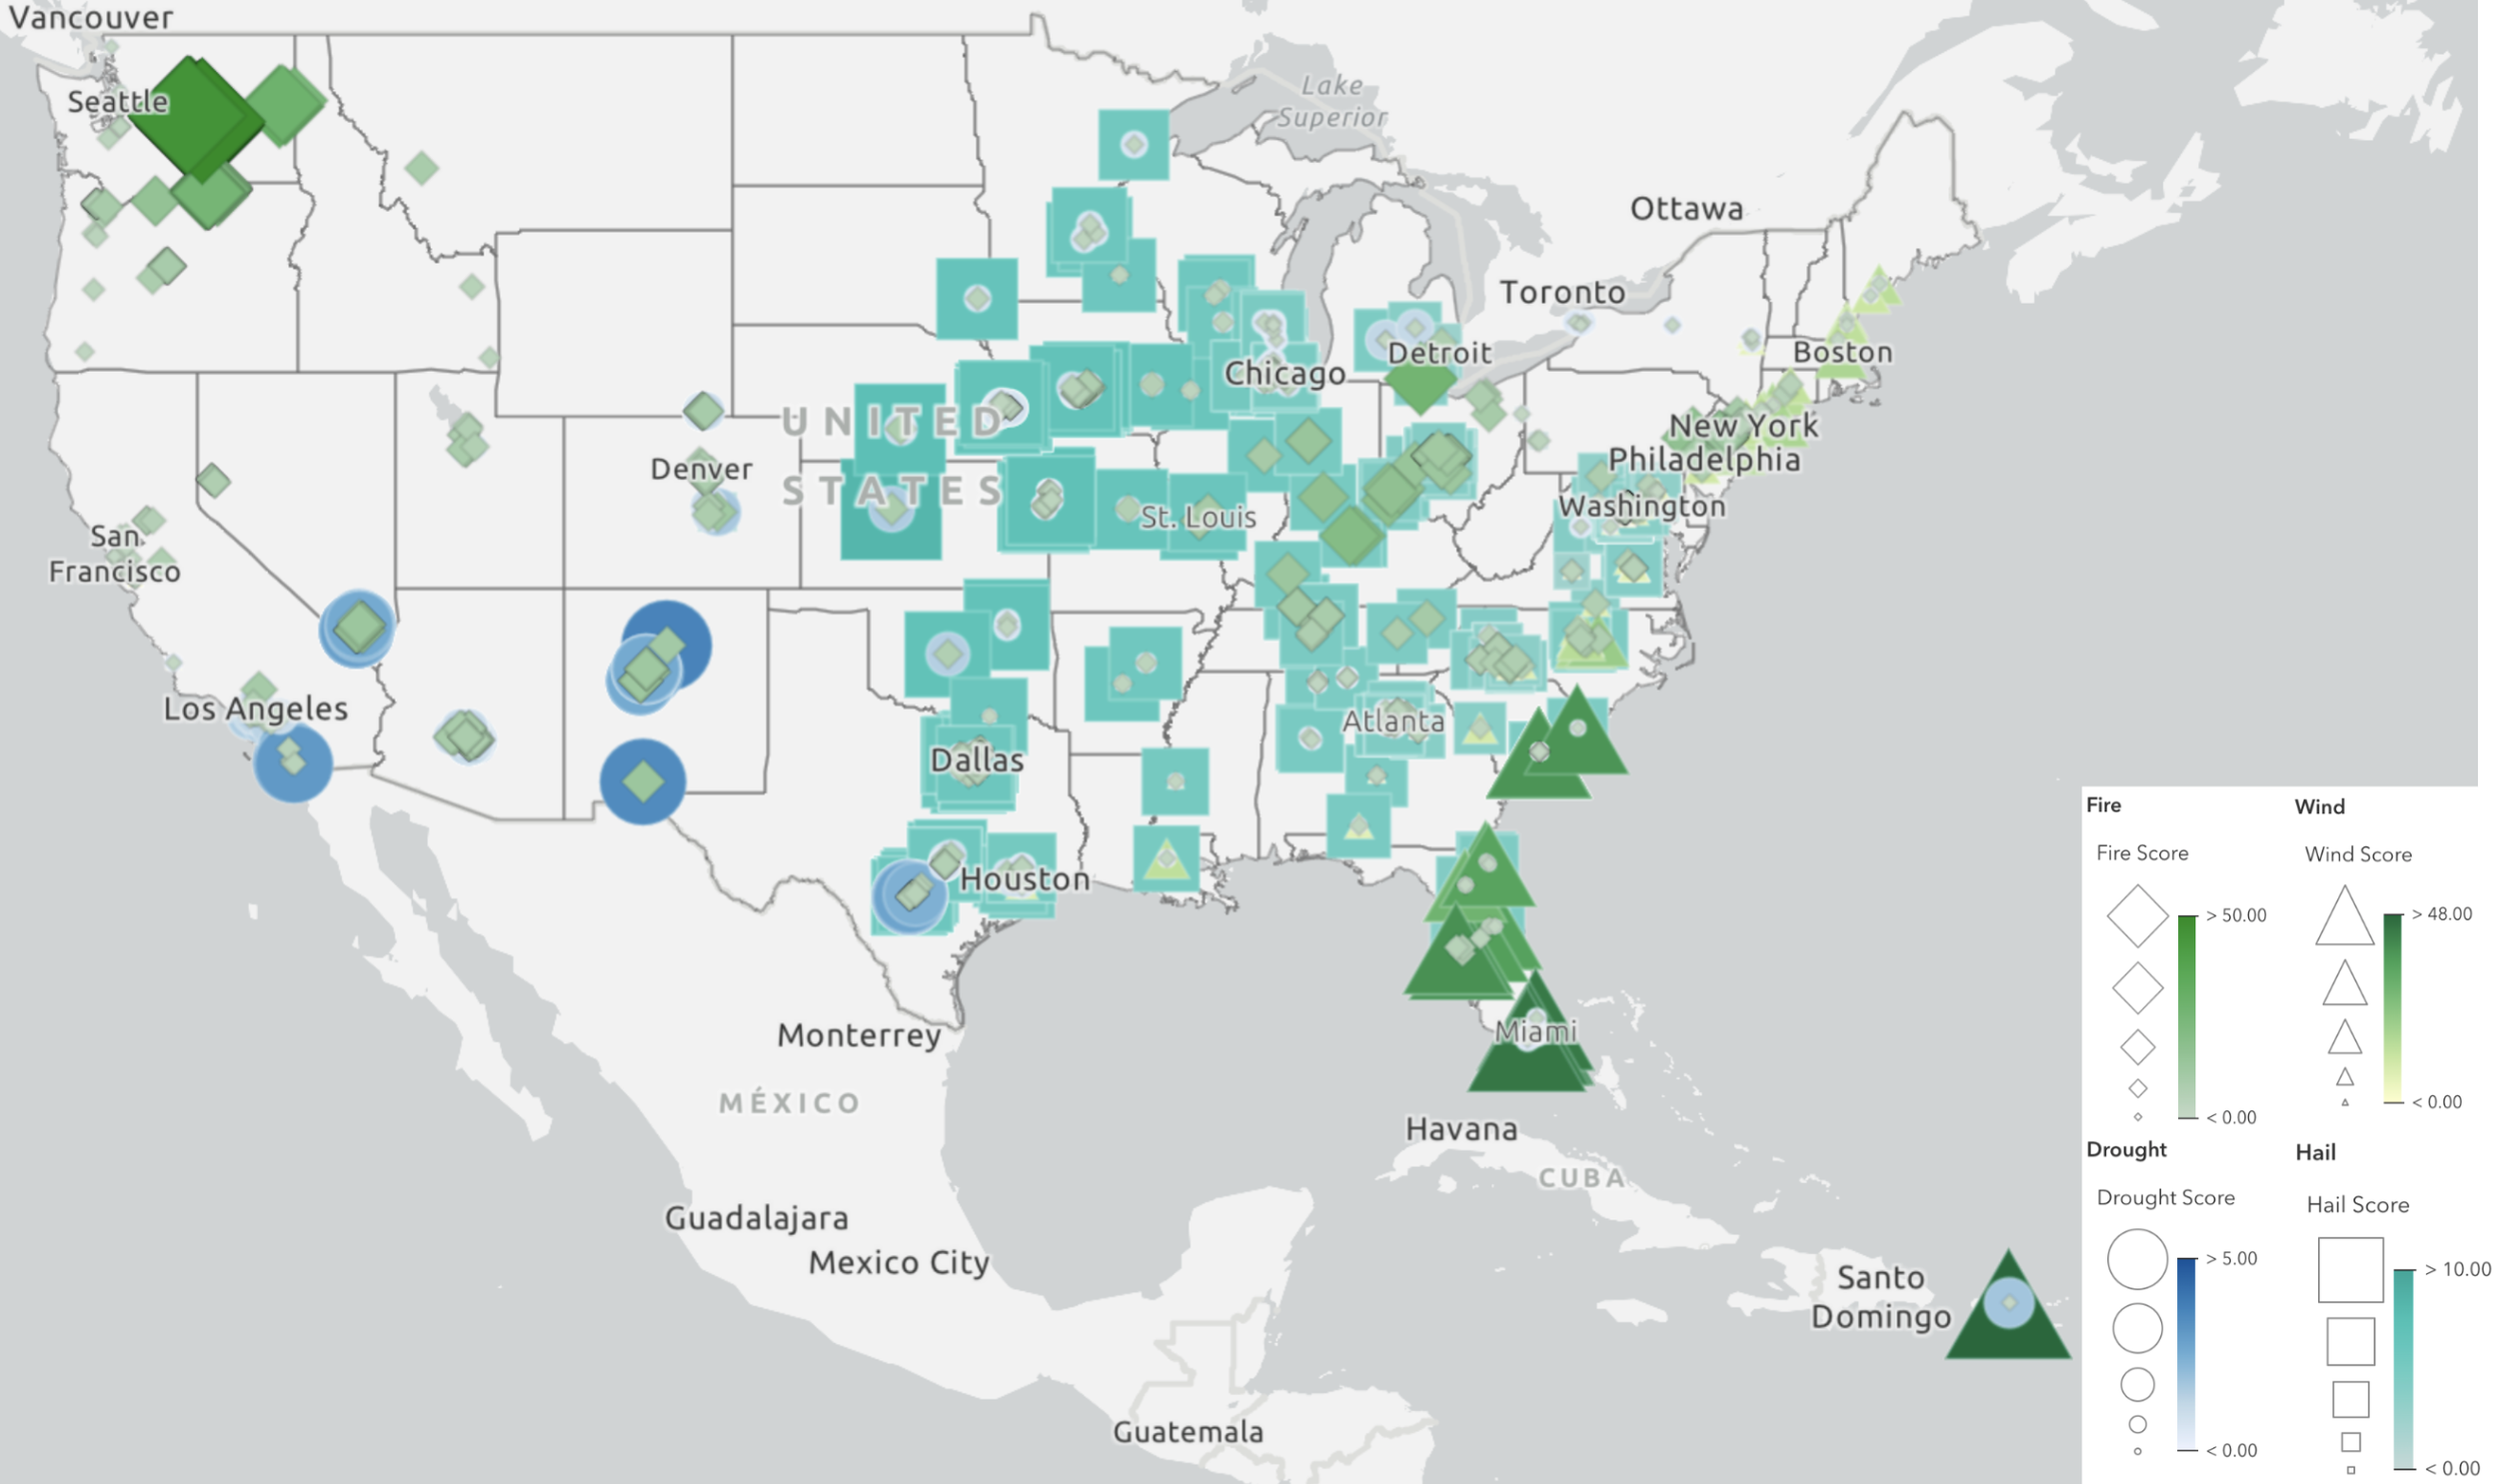
Figure 4: Relative impact of Physical Climate Risks to Data Centers (copyright TransZero)
Wildfire exposure was a major consideration in California and several western US states including Nevada, Arizona, and New Mexico. Moderate wildfire exposure also flagged areas in Colorado and Washington State. With increasing temperatures predicted from 2026 through to 2100, the long‑term risk profile of wildfire was generally an upward curve.
Extreme hail (defined as being larger than 2cm in diameter) risk forms a distinct corridor across the central United States, encompassing Nebraska, Kansas, Iowa, Oklahoma, northern Texas, and Missouri. This region aligns with the climatological “hail belt” associated with the severe convective storm (SCS) systems that regularly impact the great plains. A large number of data centres were within this zone.
The impacts of extreme temperature accounted for 16% of expected annual climate losses in the TransZero modelling. This was anticipated through higher energy costs required for cooling facilities in periods of warm weather (defined here as being days above 25 degrees Celsius). This is typically through elevated air conditioning use, higher energy demands and equipment wear. The risk to this particular peril is concentrated in areas around the southern United States, with the highest levels observed in states such as Florida, South Texas, and neighboring states across the broader southern tier. While these impacts may not always translate into catastrophic losses, they represent chronic stressors that can erode system performance and reliability over time.
Drought is a related climate peril, emerging as a growing concern across several southern regions. Moderate drought exposure is observed in San Diego, Las Vegas, Albuquerque, and San Antonio. Although drought is a threat to more of the southwestern states, these conditions constrain water availability for cooling systems and increase wildfire susceptibility, creating compounding risks for data centre operations in already water‑stressed environments. Unsurprisingly, correlation of risk and financial loss results between temperature and drought showed a high positive Pearson’s correlation (r=0.72). This reflects the climatological coupling of heat and aridity in the southwest, suggesting that facilities in these regions may face compound cooling and water‑availability stressors.
Wind accounted for 12% of modelled annual climate losses to the data centres with coastal regions in Florida and the Carolinas highlighting some high risk exposures. However, data centre exposure to hurricane risk was generally limited.
Subsidence risk can cause building foundation cracking and failure. While somewhat rare, the costs of remediation can be extremely high. In the U.S. this peril is more widespread across the Eastern seaboard regions, as well as close to the clay-rich soils of rivers like the Mississippi. Local geology and soil moisture deficit are major contributors of this risk, as well as regions susceptible to major groundwater extraction and soil compaction. Despite its broad spatial risk footprint, subsidence is relatively rare and was not a major contributor of loss to most data centers.
Lastly, rainfall intensity poses a widespread hazard, affecting multiple regions simultaneously. High-intensity rainfall is prevalent along the coasts of Washington, Oregon, and California; across the Gulf states; along the Eastern Seaboard; and in inland areas such as Tennessee, Missouri, and Kentucky. Because intense rainfall can overwhelm drainage systems and exacerbate flood conditions, this hazard often interacts with and amplifies flood risk, particularly in densely developed urban areas.
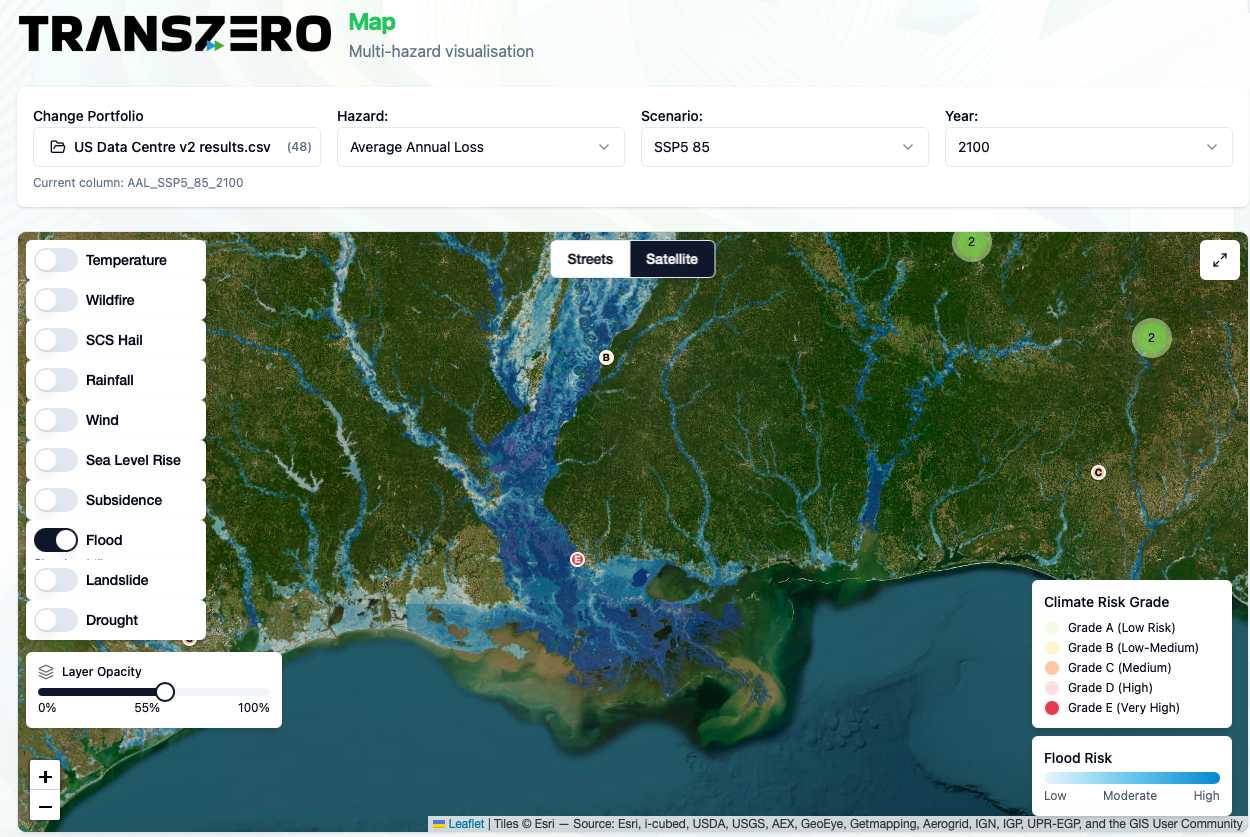
Figure 5: Data Centres and the 100-year Flood Risk, Louisiana, U.S. (copyright TransZero)
The research highlighted 108 (9%) of data centers had a material river flood risk, 72 (6%) had a surface water (flash) flood risk, and just 18 (1%) were at risk of both perils. Figure 5 highlights the proximity of some Data Centres to the major flood risk (100-year) in Louisiana. While some specific locations saw very high losses, overall this peril contributed only 6% to the annual climate losses to all data centers.
The Impact of Climate Adaptation Measures
Data centres are a fast-growing energy consumer. Due to the expansion of AI and hyper-scale computing, cooling systems now account for a significant share of total energy demand, which is projected to rise over the next decade. The global economic burden of cooling could reach $3.3 trillion by 2055, driven by higher ambient temperatures and the increased reliance on energy-intensive cooling systems (World Economic Forum 2025). Water-based cooling systems also become less reliable when drought and extreme temperatures are highly correlated.
Data centres are not passive victims of climate change as many operators invest heavily in resilience and future sustainability. Common adaptation strategies include perimeter flood defences, elevated electrical and cooling systems, backup power generation, fire‑resistant landscaping, and advanced drainage design. Within the TransZero platform, the ‘Adapt’ module was used to capture the % impacts of alternative adaptation measures on annual losses. Figure 6 provides a comparison between financial losses for data centres with and without adaptation.
Larger points in Figure 6 highlight how some locations see much higher reductions in losses compared to others. These points are closer to the bottom (x axis) of the chart.
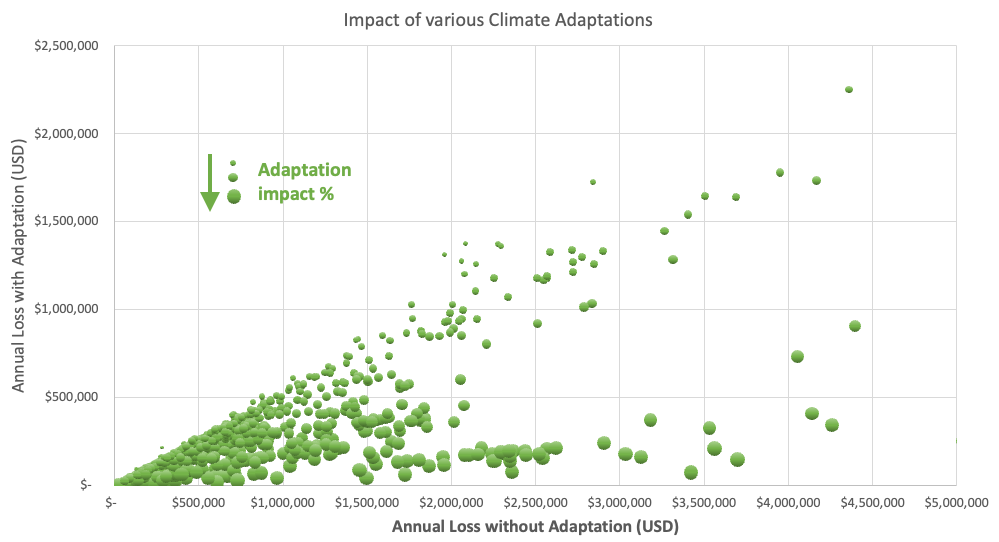
Figure 6: Cumulative reduction in Data Centre climate losses (copyright TransZero)
Adaptation reductions are highly site and hazards specific. For example, a location with a flood risk of <1m at the 100-year level can see dramatic reductions in annual losses when flood‑defence measures are adopted. Whereas locations with either depth far exceeding this (>4m) will continue to see losses despite the 1m defence measure and similarly locations with no current risk will see no difference. Wind and hail resilience adaptations can be particularly effective in respective Tropical Cyclone and SCS-prone regions. Across the entire portfolio, cumulative financial savings from adaptation measures ranged between 0-98% of annual climate losses. Average loss reductions were 63%. Modelled adaptation measures included fire‑resistant materials, flood defences, hail‑resistant roof systems, mitigation to subsidence risk, and improved thermal insulation.
As we increasingly rely on cloud-hosted services and the continued rise of artificial intelligence, data centers are the engine room of the global economy. They are also vulnerable to extreme weather events - many of which will become more frequent and more severe in a warming climate. For companies to avoid being blind-sided by the potential of climate-driven outages, it’s important to understand the physical risks of their data centres.
Physical climate risk is a foundational requirement for ensuring the continuity of the digital world. For operators and investors, integrating climate risk into their long‑term capital planning, insurance strategy, and site selection is a must. Similarly, a proactive understanding of how resilience measures could reduce or offset these risks is equally as important for long term business continuity.
Contact TransZero to learn how we can support your bank or insurance company is climate-related risk modelling and disclosure reporting.
Transzero are a team of dedicated climate risk specialists, helping companies understand how climate risk will impact their business. If you’re interested to learn more about the Transzero’s climate risk services, please contact us via our web page or info@transzero.co.uk
© 2026 TransZero Ltd